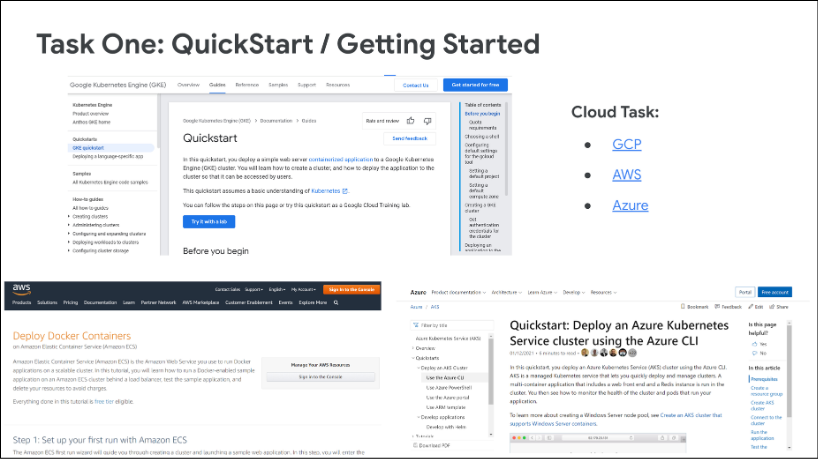
Case Study 1: Google Developer Relations
45-Participant Multi-Cloud Benchmark & Technical Documentation Architecture
45professional cloud developers benchmarked across GCP, AWS and Azure
86.7%Quickstart task success on GCP, the highest of the three platforms
26.7%Best Practices success on GCP, the drop-off that drove the overhaul
Impact Highlights
- Scope – Executed an end-to-end benchmark across 45 professional cloud developers evaluating GCP, AWS, and Azure.
- Key Performance – Identified GCP’s category-leading 86.7% success rate in Getting Started workflows alongside critical theoretical documentation drop-offs.
- Strategy Pivot – Insights directly reshaped Google Cloud’s annual developer event strategy, technical architecture, and product marketing roadmaps.
1. The Challenge & Business Context
Developer friction across technical documentation leads to platform abandonment and customer churn toward competing ecosystems. Google Developer Relations required an objective, competitive benchmark comparing Google Cloud Platform (GCP) resources directly against Amazon Web Services (AWS) and Microsoft Azure to inform systemic documentation redesigns.
Primary Objectives
- Pinpoint exact journey friction across developer skill levels and documentation types.
- Deliver quantitative and qualitative evidence to software engineering directors and DevRel leadership to guide product resource architecture.
2. Research Strategy & Execution
I designed and executed a rigorously balanced competitive benchmark study (N=45) across GCP, AWS, and Azure (n=15 per ecosystem).
- Participant Sample – Recruited professional cloud developers spanning 1 to 5+ years of active cloud development experience. Screeners ensured participants evaluated platforms and documentation sets they had not previously used to prevent ecosystem bias.
- Mixed Methods – Combined task-based usability testing, System Usability Scale (SUS) scores, Net Promoter Score (NPS) distributions, and qualitative retrospectives across four primary document types.
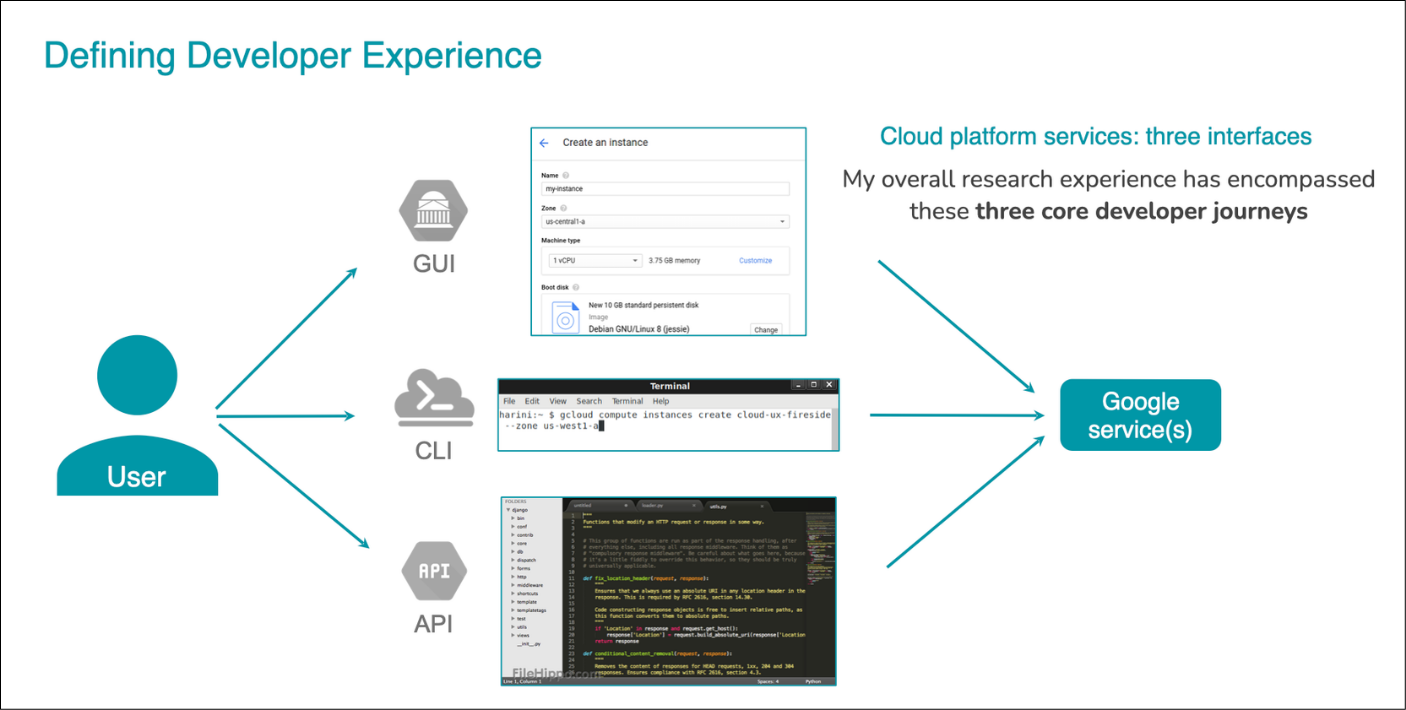
Multi-Cloud Benchmark Results Summary
| Metric / Document Type | Google Cloud (GCP) | Amazon Web Services (AWS) | Microsoft Azure |
|---|---|---|---|
| Overall SUS Score | 65.18 | 52.33 | 71.17 |
| Overall NPS Distribution | 29% Promoters / 14% Detractors | 20% Promoters / 47% Detractors | 20% Promoters / 20% Detractors |
| Quickstart Task Success | 86.7% (13/15) | 53.3% (8/15) | 73.3% (11/15) |
| Tutorial Task Success | 33.3% (5/15) | 46.7% (7/15) | 80.0% (12/15) |
| Best Practices Success | 26.7% (4/15) | 46.7% (7/15) | 86.7% (13/15) |
| How-To Guide Success | 40.0% (6/15) | 40.0% (6/15) | 40.0% (6/15) |
3. Key Insights
- Developers and DevOps engineers exhibit identical navigation behaviors: constantly toggling between step-by-step documentation and active workspace/console windows, staying almost exclusively within official resources.
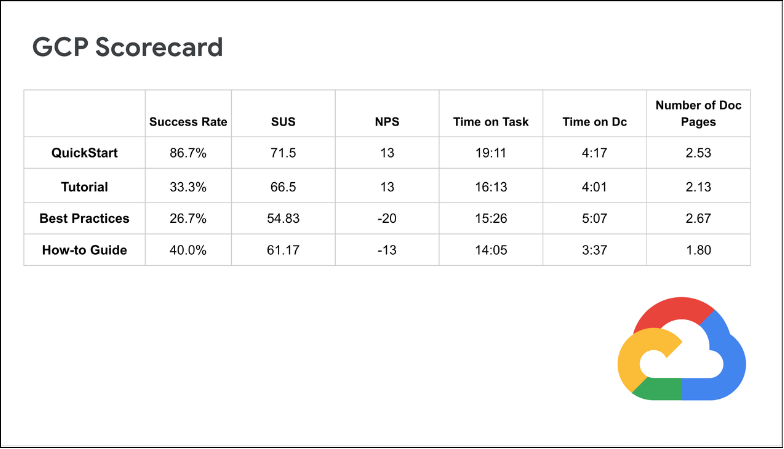
- GCP recorded the highest Quickstart success rate across all platforms (86.7%, SUS 71.5). However, completion plummeted on Best Practices docs (26.7%, SUS 54.83) due to overly theoretical explanations lacking actionable code samples.
- While Azure led overall usability in Tutorials (80.0%) and Best Practices (86.7%), performance collapsed on How-to Guides (40.0% success, SUS 44.33, NPS -20) due to missing terminal commands and assumed prior knowledge.
- AWS exhibited negative NPS across all tested documentation categories due to outdated visual signposting, confusing naming conventions, and overwhelming unguided options.
4. Business & Product Impact
- Presented comparative findings directly to VP of Developer Experience and Software Engineering Directors, securing buy-in for a structured documentation overhaul.
- Findings directly altered Google’s annual developer event strategy, technical resource architecture, and novice-to-expert developer onboarding pathways.